
Coronavirus: Regional heat maps reveal where COVID-19 is ‘creeping up’ into older age groups
Written by News on 12/10/2020
Coronavirus is “creeping up” into older, more vulnerable age groups, England’s deputy chief medical officer has said, as he unveiled heat maps showing how the virus is spreading in different parts of the country.
Professor Jonathan Van-Tam said the rise in COVID-19 cases is being seen “nationwide” and “pretty much all areas of the UK are now seeing growths in the infection rate”.
He told a news conference that other regions are following the pattern of the North West of England where the virus has moved through the age bands, having started spiking among young people at first.
Live updates on coronavirus from US, UK and around world
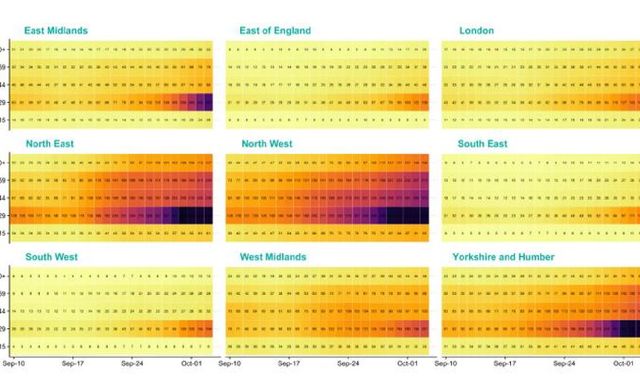
The regional heat maps show age groups 0 to 15, 16 to 29, 30 to 44, 45 to 59 and 60 plus on the y-axis, and dates from mid-September to early October on the x-axis.
The colours range from yellow (meaning fewer than 100 cases per 100,000 people), orange (between 100 and 200 cases per 100,000), red/light purple (between 200 and 300 cases per 100,000), purple (between 300 and 400 cases per 100,000) and dark purple/black (between 400 and 500 cases per 100,000).
Addressing the regional heat maps, Prof Van-Tam said: “You will see that the infection rate was initially highest in the 16 to 29-year-olds and that, as you move to the right, just gets hotter and hotter.
“But as it does so, you can see the incremental creep of the infection into the next age band up, 30 to 44, followed two or three weeks later by a creep-up again into the 45 to 59s, and you can now see that the 60 plus are also heating up on that chart.
“The North West experienced all of this first and my understanding is that pattern is likely to be followed – you can see it in the North East and you can see it in Yorkshire and the Humber just beginning but at an earlier stage.”
Prof Van-Tam said the spread of the virus into the 60-plus age group was “of significant concern”.
“The elderly suffer a much worse course with COVID-19, they are admitted to hospital for longer periods, and they are more difficult to save,” he added.
Prof Van-Tam also addressed a slide shown in the briefing about rates of coronavirus cases increasing in the south of England.
He said he was concerned he may have presented a “bi-polar picture that COVID-19 is a problem in the North and not a problem in the South”.
“On the contrary, the epidemic this time has clearly picked up pace in the north of England earlier than it did in the first wave and that almost certainly relates to the fact the disease levels in the North, and certainly in the North West, never dropped as far in the summer as they did in the South,” he added.
“But pretty much all areas of the UK are now seeing growths in the infection rate and that extending brown map that I showed you, which is sourced from the Joint Biosecurity Centre, absolutely makes that point.
“This is a nationwide phenomenon now that rates are changing upwards across the UK.”
Prof Van-Tam was speaking at a news briefing ahead of an announcement on further restrictions from Prime Minister Boris Johnson.
(c) Sky News 2020: Coronavirus: Regional heat maps reveal where COVID-19 is ‘creeping up’ into older age groups